
The Copernicus Climate Change Service (C3S), implemented by the European Centre for Medium-Range Weather Forecasts on behalf of the European Commission with funding from the EU, routinely publishes monthly climate bulletins reporting on the changes observed in global surface air temperature, sea ice cover and hydrological variables. This month, highlights about sea surface temperature are also included in this press release. All the reported findings are based on computer-generated analyses using billions of measurements from satellites, ships, aircraft and weather stations around the world.
July 2023 – Surface air temperature highlights:
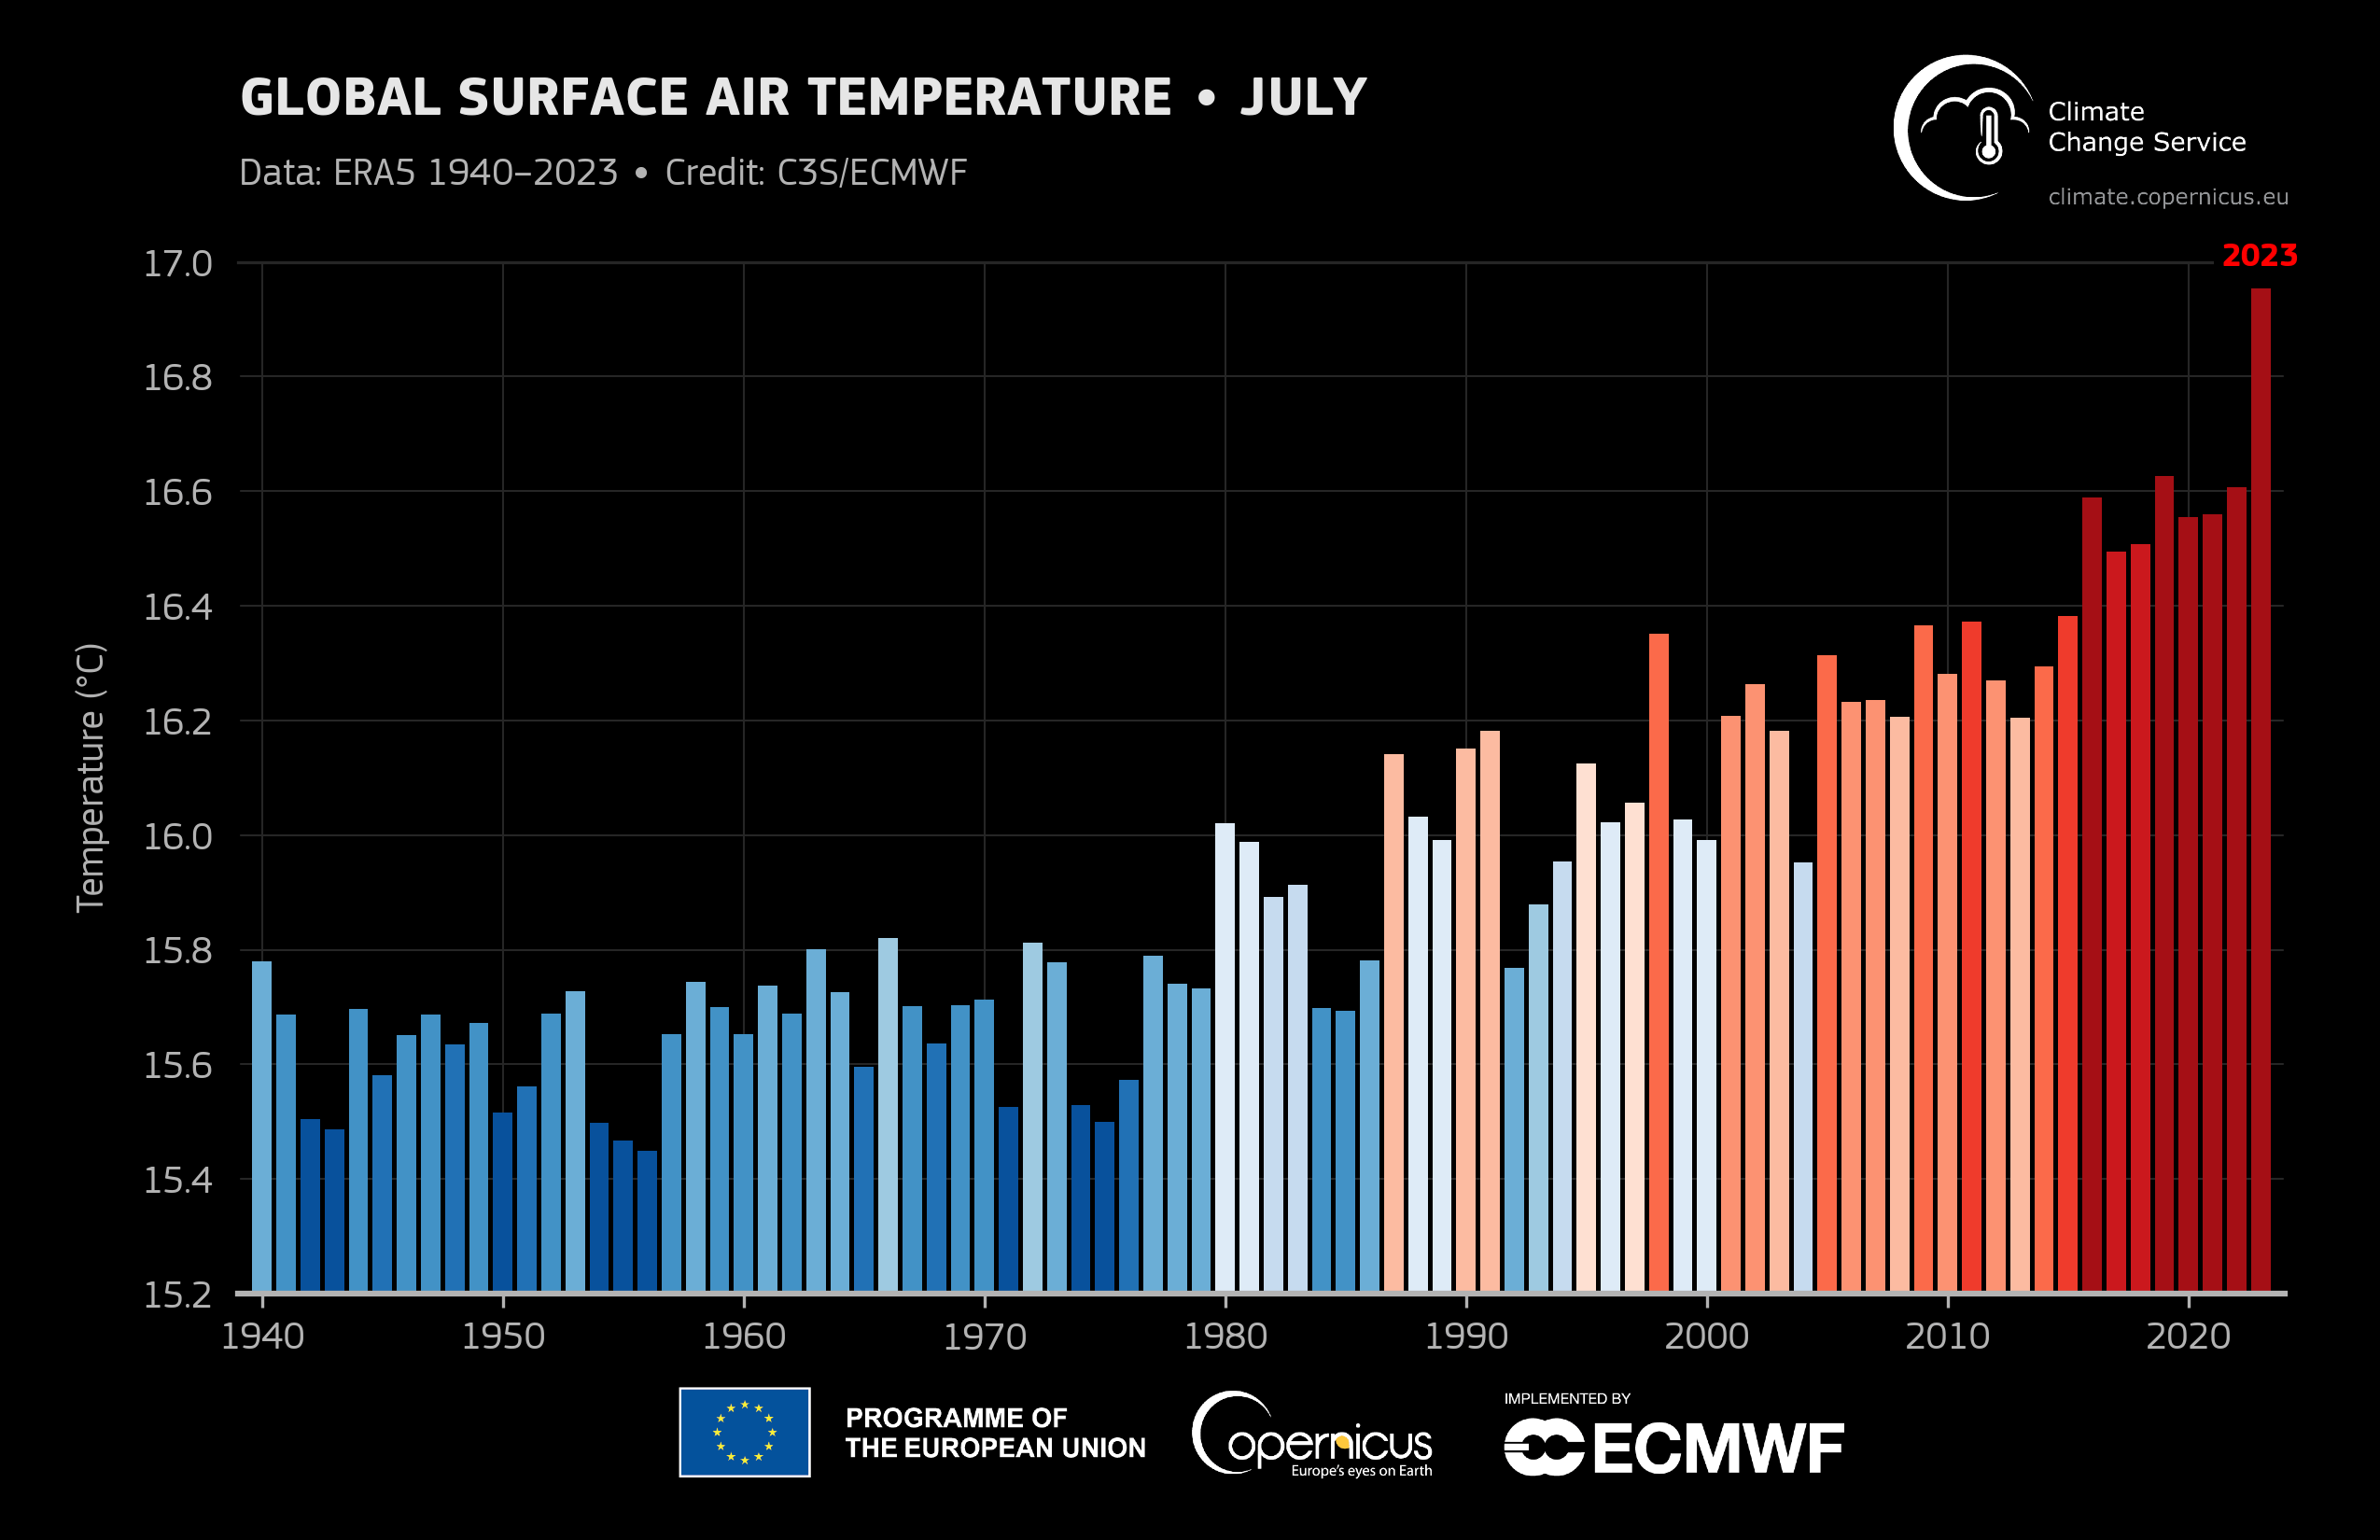
- The global average temperature for July 2023 is confirmed to be the highest on record for any month.
- The month was 0.72°C warmer than the 1991-2020 average for July, and 0.33°C warmer than the previous warmest month, July 2019.
- The month is estimated to have been around 1.5°C warmer than the average for 1850-1900.
- Heatwaves were experienced in multiple regions of the Northern Hemisphere, including southern Europe.
- Well-above average temperatures occurred over several South American countries and around much of Antarctica.
July 2023 – Sea surface temperature highlights:
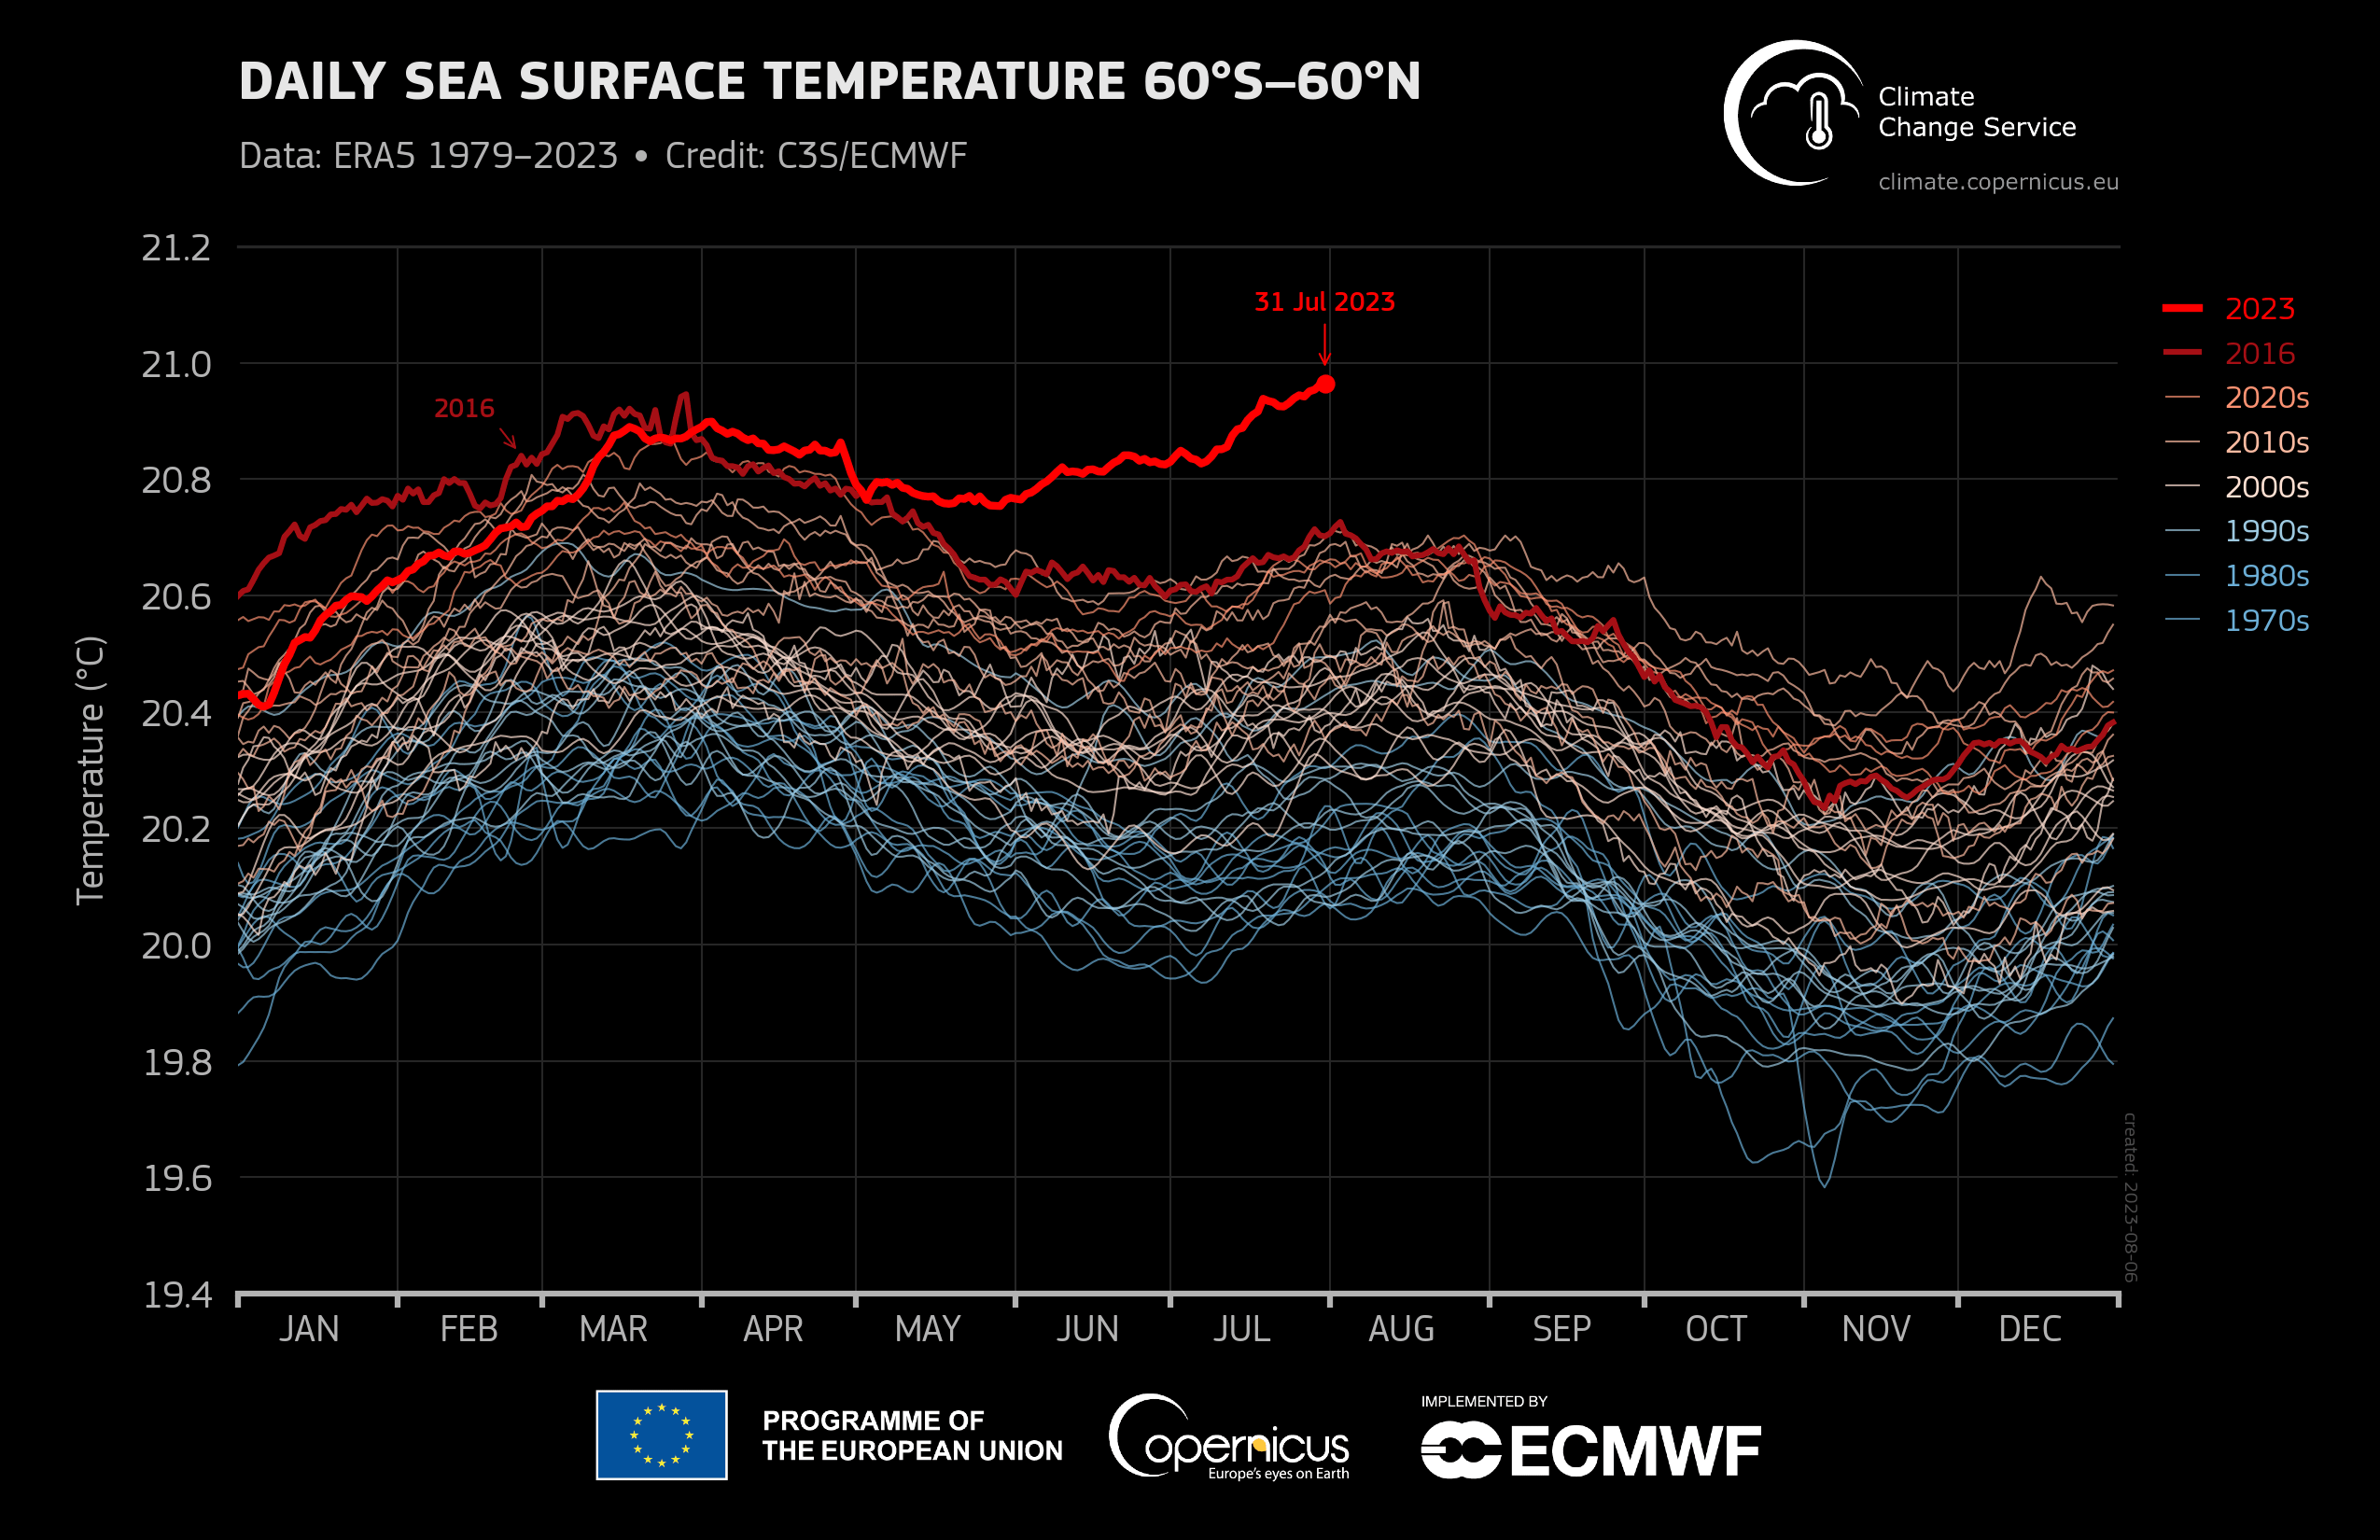
- Global average sea surface temperatures* continued to rise, after a long period of unusually high temperatures since April 2023, reaching record high levels in July
- For the month as a whole, global average sea surface temperatures were 0.51°C above the 1991-2020 average
- The North Atlantic was 1.05°C above average in July, as temperatures in the northeastern part of the basin remained above average, and unusually high temperatures developed in the northwestern Atlantic
- Marine heatwaves developed south of Greenland and in the Labrador Sea, in the Caribbean basin, and across the Mediterranean Sea
- El Niño conditions continued to develop over the equatorial eastern Pacific.
According to Samantha Burgess, Deputy Director of the Copernicus Climate Change Service (C3S): “We just witnessed global air temperatures and global ocean surface temperatures set new all-time records in July. These records have dire consequences for both people and the planet exposed to ever more frequent and intense extreme events.”
“2023 is currently the third warmest year to date at 0.43ºC above the recent average, with the average global temperature in July at 1.5°C above preindustrial levels. Even if this is only temporary, it shows the urgency for ambitious efforts to reduce global greenhouse gas emissions, which are the main driver behind these records.”
Comparing averages for the calendar year to date, from January to July, the global mean for 2023 is the third highest on record, at 0.43°C relative to 1991-2020, compared with 0.49°C for 2016 and 0.48°C for 2020. The gap between 2023 and 2016 is expected to narrow in the coming months, as the latter months of 2016 were relatively cool (reducing the annual average to 0.44°C), while the remainder of 2023 is expected to be relatively warm as the current El Niño event develops.
July 2023 – Sea Ice Highlights:
- Antarctic sea ice extent continued to break records for the time of year, with a monthly value 15% below average, by far the lowest July extent since satellite observations began.
- As in June, the daily Antarctic sea ice extent remained substantially below previously observed values for the time of year throughout the month.
- Sea ice concentrations were most below-average in the northern Weddell, eastern Bellingshausen, and northern Ross Seas while above-average concentrations persisted in a broad Amundsen Sea sector.
- Arctic sea ice extent was slightly below average, but well above the record minimum from July 2020.
- While most of the Arctic Ocean saw below-average sea ice concentrations, above-average concentrations prevailed north of the northern Siberian coast.
June 2023 – Hydrological variables highlights:
- July 2023 was wetter than average over most of northern Europe and in a region from the Black Sea and Ukraine to northwestern Russia.
- Drier-than-average conditions were experienced across the Mediterranean basin, with Italy and southeastern Europe having the largest anomalies.
- Beyond Europe, July 2023 was wetter than average over northeastern North America, Afghanistan, Pakistan, northeastern China, northern and eastern Australia, and Chile.
- Extratropical drier-than-average regions included Mexico and the southwestern United States, central and southeastern Asia, southwestern Australia, and parts of southern Brazil and Paraguay.
* The findings about global sea surface temperatures (SSTs) presented here are based on SST data from ERA5 averaged over the 60°S–60°N domain. Note that ERA5 SSTs are estimates of the ocean temperature at about 10m depth (know as foundation temperature). The results, e.g. date of the highest value in 2023, may differ from other SST products providing temperature estimates at different depths, such as 20cm depth for NOAA’s OISST.
More information on the air surface temperatures in July 2023 can be found here.
More information on the sea surface temperatures in July 2023 can be found here.
Video material accompanying the maps can be found here.
More information about climate variables in June and climate updates of previous months as well as high-resolution graphics and the video can be downloaded here.
Answers to frequently asked questions regarding temperature monitoring can be found here.
Information about the C3S data set and how it is compiled:
Temperature and hydrological maps and data are from ECMWF Copernicus Climate Change Service’s ERA5 dataset.
Sea ice maps and data are from a combination of information from ERA5, as well as from the EUMETSAT OSI SAF Sea Ice Index v2.1, Sea Ice Concentration CDR/ICDR v2 and fast-track data provided upon request by OSI SAF.
Regional area averages quoted here are the following longitude/latitude bounds:
Globe, 180W-180E, 90S-90N, over land and ocean surfaces.
Europe, 25W-40E, 34N-72N, over land surfaces only.
More information can be found here.
Information on national records and impacts:
Information on national records and impacts are based on national and regional reports. For details see the respective temperature and hydrological C3S climate bulletin for the month.
C3S has followed the recommendation of the World Meteorological Organization (WMO) to use the most recent 30-year period for calculating climatological averages and changed to the reference period of 1991-2020 for its C3S Climate Bulletins covering January 2021 onward. Figures and graphics for both the new and previous period (1981-2010) are provided for transparency.
More information on the reference period used, can be found here.
About Copernicus and ECMWF
Copernicus is a component of the European Union’s space programme, with funding by the EU, and is its flagship Earth observation programme, which operates through six thematic services: Atmosphere, Marine, Land, Climate Change, Security and Emergency. It delivers freely accessible operational data and services providing users with reliable and up-to-date information related to our planet and its environment. The programme is coordinated and managed by the European Commission and implemented in partnership with the Member States, the European Space Agency (ESA), the European Organisation for the Exploitation of Meteorological Satellites (EUMETSAT), the European Centre for Medium-Range Weather Forecasts (ECMWF), EU Agencies and Mercator Océan, amongst others.
ECMWF operates two services from the EU’s Copernicus Earth observation programme: the Copernicus Atmosphere Monitoring Service (CAMS) and the Copernicus Climate Change Service (C3S). They also contribute to the Copernicus Emergency Management Service (CEMS), which is implemented by the EU Joint Research Centre (JRC). The European Centre for Medium-Range Weather Forecasts (ECMWF) is an independent intergovernmental organisation supported by 35 states. It is both a research institute and a 24/7 operational service, producing and disseminating numerical weather predictions to its Member States. This data is fully available to the national meteorological services in the Member States. The supercomputer facility (and associated data archive) at ECMWF is one of the largest of its type in Europe and Member States can use 25% of its capacity for their own purposes.
ECMWF has expanded its location across its Member States for some activities. In addition to an HQ in the UK and Computing Centre in Italy, offices with a focus on activities conducted in partnership with the EU, such as Copernicus, are in Bonn, Germany.
The Copernicus Atmosphere Monitoring Service website can be found at http://atmosphere.copernicus.eu/
The Copernicus Climate Change Service website can be found at https://climate.copernicus.eu/
More information on Copernicus: www.copernicus.eu
The ECMWF website can be found at https://www.ecmwf.int/